01
Live Dashboards
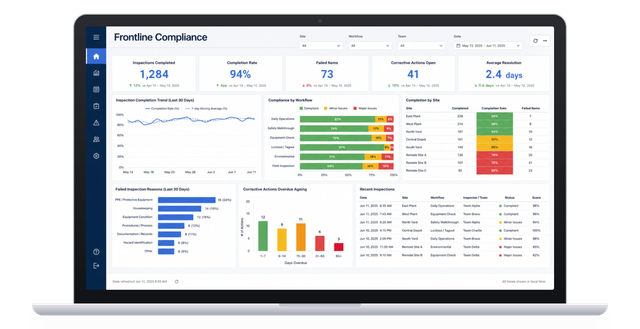
Monitor performance, compliance, readiness and operational activity through configurable real-time views.
ANALYTICS & OPERATIONAL INTELLIGENCE
Bring frontline, asset, workforce, security and sensor data together through live dashboards and AI that flags what needs attention, explains why it happened and recommends the next action.
ONE VIEW OF YOUR OPERATION
01
Monitor performance, compliance, readiness and operational activity through configurable real-time views.
02
Focus attention on failed inspections, open issues, overdue actions and abnormal operational events.
03
Identify recurring faults, emerging risks and performance patterns across time.
04
Build reporting views around the measures, teams, sites and assets that matter to your operation.
AI-ASSISTED INTELLIGENCE
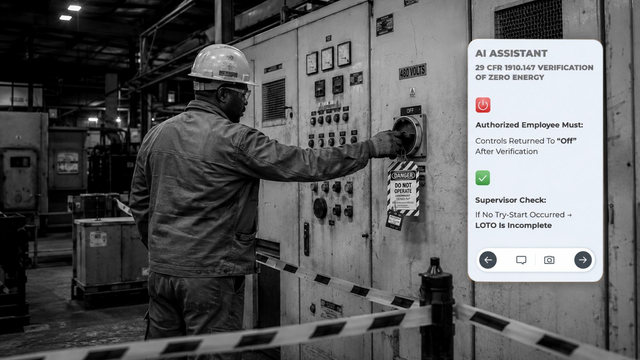
AI works across your operational data to flag unusual activity, predict where risk is building and summarise what changed, so teams spend less time searching dashboards and more time acting.
01
Flag unusual readings, missed activity and out-of-pattern behaviour as it happens.
02
Spot assets, sites and teams trending towards failure or non-compliance before it happens.
03
Ask questions about performance, incidents or assets and get answers drawn from your data.
04
Daily and weekly briefings that highlight what changed, what is overdue and what to prioritise.
CONNECT YOUR OPERATION
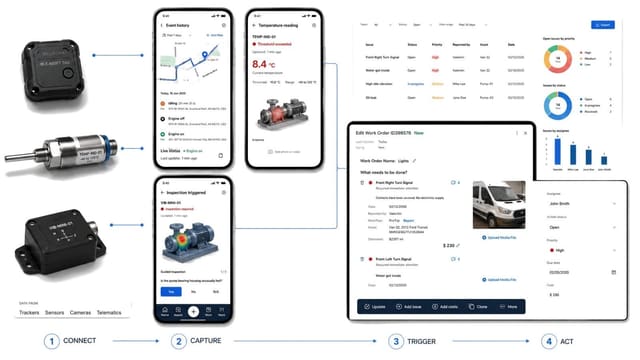
Connect information from inspections, workflows, assets, sensors, vehicles, cameras, communication systems and workforce platforms. Rather than reviewing each system independently, teams can bring operational information together to build a more complete view of what is happening across the organisation.
TECHNOLOGY ECOSYSTEM
Bring data from frontline workflows, workforce and attendance systems, assets and sensors, communication, video and security platforms into one connected environment, giving teams a clearer, more complete view of what is happening across the business.
TURN VISIBILITY INTO ACTION
Move from an executive-level dashboard into the site, asset, workflow or incident behind the data. When something requires attention, analytics can connect directly to alerts, investigations, inspections, corrective actions and escalation workflows.
01
Identify an operational exception, trend or change.
02
Review the information and context behind the data.
03
Move into the relevant site, asset, workflow or incident.
04
Trigger the required alert, inspection, corrective action or escalation.
05
Use the resulting operational information to support better future decisions.
THE RIGHT VIEW FOR EVERY ROLE
Executives, managers, supervisors and control rooms do not need the same level of detail. Create views that surface the measures, exceptions and operational information relevant to each level of responsibility, from board-level performance to the next action on a single site.

01
Organisation-wide performance, risk, compliance and readiness at a glance, with trends over time.
02
Compare regions, sites and teams, and track targets, costs and service levels.
03
Shift activity, open issues, overdue actions and team performance on each site.
04
Live alerts, exceptions and incidents that need a response now.
05
Assigned tasks, inspections and actions for each worker on their own device.
06
Service-level and compliance reporting shared with clients and stakeholders.
SEE THE PATTERN BEHIND THE EVENT
Use historical operational information to identify recurring faults, developing risks and performance patterns over time. Compare activity across sites, teams, assets and operational processes to understand where improvement may be required.
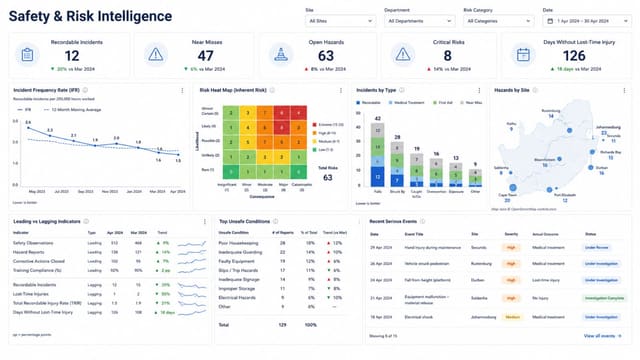
REAL-TIME OPERATIONAL INTELLIGENCE
Bring performance, compliance, assets, workforce activity and exceptions into a central view that helps teams understand what requires attention now. Move from high-level operational visibility into the underlying site, asset, workflow or event when more detail is needed.
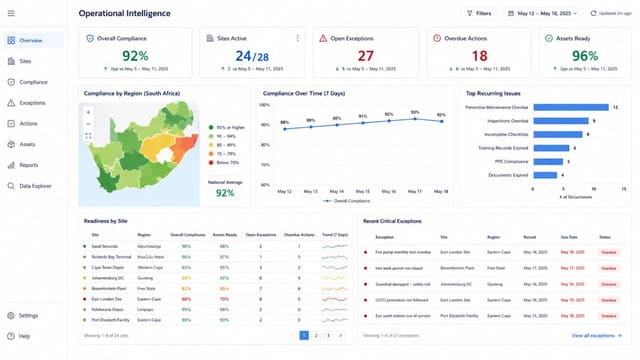
01
Monitor key measures across teams, sites and processes.
02
See failed inspections, incomplete requirements and areas needing attention.
03
Understand whether critical equipment is operationally ready.
04
Monitor unresolved actions and operational problems.
05
Surface work that has passed its required completion point.
06
Identify unusual activity and recurring patterns.
Use cases
Give management one view of what is ready, what is not and why.
Read the Use CaseFind the fault that keeps coming back.
Read the Use CaseTurn thousands of frontline checks into a picture management can actually use.
Read the Use CaseSee where the operation needs attention without reading fifty site reports.
Read the Use CaseMore in Digitise Operations

MAKE EVERY CRITICAL ASSET VISIBLE
Connect physical equipment to digital operations through real-time tracking, condition monitoring and connected workflows.